
Demographics
With other research studies’ reported demographics in mind, I sought a broad perspective of opinions for Examining the Romance Reader. Therefore, I asked for gender identity, age range, race, ethnicity, sexual orientation, relationship/familial status, income range, and country of residence. I found it pertinent to the research to comprehend how the participant’s experiences may have impacted their answers.
Diaz-Young, J. (2023). Transreadathon Post [Photo]. Chick Lit Is The Sh*t.
In my primary research, I found that a great deal of data was collected within the gender binary only. Nonbinary authors and readers are a growing population in the romance genre and should be considered in research. Whether it’s Buzzfeed announcing must-reads from nonbinary authors in 2022⁵ or the Trans Rights Readathon this year, started by author Sim Kern⁶, it's clear that books representing this demographic are making a splash in the romance genre.
Despite many outreach efforts, my demographics were similar to those in Curcic’s study, which provides the most recent and comprehensive data on the genre that I used for comparison with my own work.⁷ Nevertheless, since my research is focused on diversity in the genre, my demographic questions were further in-depth. Beyond race, I deemed it necessary to ask about income, country, sexuality, etc. I also asked participants tough questions about diversity in their reading to start the conversation. This project’s aim is not to shame people for not knowing everything about diverse romance but rather to show a greater audience that this beloved genre is no longer simply for straight, white, cisgender, thin, and able-bodied people.
Chart 2: Age Range
Chart 1: Gender Identity

Main Insight: Most respondents identify as female.

Main Insight: Largest age group was 25 to 34.
Chart 3: Race & Ethnicity

Main Insight: Most participants are White and not Hispanic/Latine. Participants were able to select all that apply, so those identifying as White may include biracial people. There were multiple Afro-Latinos who participated in this study, so please be mindful that Hispanic/Latine does not only represent Mestizos, a Hispanic/Latine person of mixed race, having both Spanish and Indigenous descent.⁸
Chart 4: Sexual Orientation

Main Insight: Straight/Heterosexual was the most common sexual orientation of respondents.
Chart 6: Income & Familiar Unit
Chart 5: Relationship Status
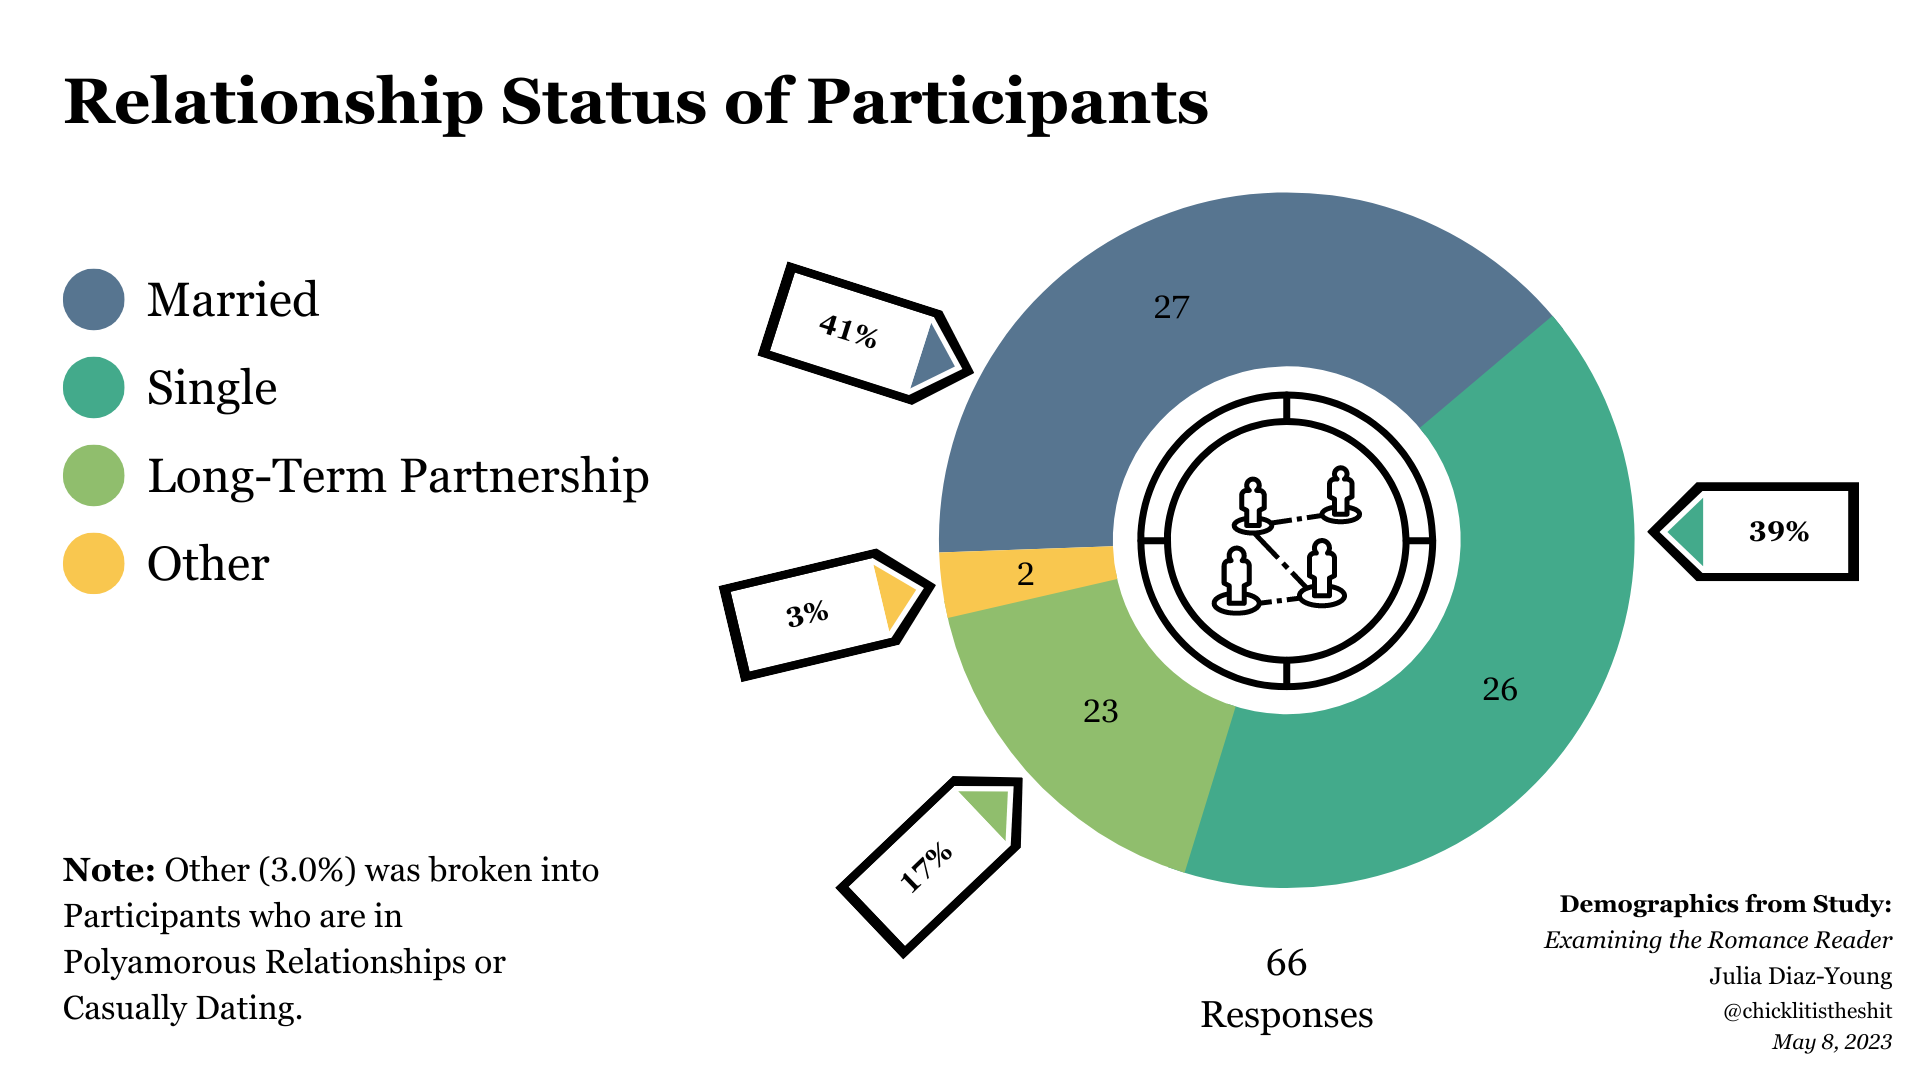
Main Insight: There are slightly more married participants, but they are followed closely by single participants.

Main Insight: Most participants do not have children and have an income over $100K.
Chart 7: Current Country of Residence

Main Insight: Most participants live in the United States.
Demographics Takeaways
In summary, the average respondent for this study identifies as Female, is 35 to 44, White, not Hispanic/Latine, Straight, Married, lives in the United States, has No Children, with a household income of over $100K.

If I were to repeat this study, I would make the following changes. I would expand the income range to intervals up to $500K. I’m curious about the ranges of the 23 respondents who listed over $100K as their household income. I would ask them to specify if that income is theirs solely or shared with a partner. I would ask for the number of children to account for spending freedom. I would like to ask if they identify as disabled. I would like to ask more about the regions they live in; for example, do you live in a city, town, or rural area? The answer to this question could vastly change their access to bookstores or other literary resources, as well as their discretionary spending power.
As readers, publishers, and authors, we need to consider how to make romance more accessible to all. To achieve this, we can focus on three key components: increasing representation, offering affordable options for obtaining books, and making reading easier for those with disabilities.
Citations for this Section
Source 5:
Hogan, J. (2022, January 22). 22 great books by trans and nonbinary authors releasing in 2022 that belong on your TBR list. BuzzFeed. Retrieved May 1, 2023.
Source 6:
Ellis, D. (2023, March 16). Join the Trans Rights Readathon March 20-27! BOOK RIOT. Retrieved May 1, 2023.
Source 7:
Curcic, D. (2022, October 9). Romance Novel Sales Statistics. WordsRated. Retrieved April 26, 2023.
Source 8:
Britannica, T. Editors of Encyclopaedia (2019, September 12). mestizo. Encyclopedia Britannica. Retrieved May 3, 2023.